0:00
The total return since I started doing
0:02
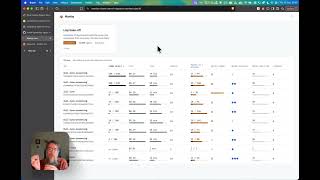
these about 5 months ago, 120%
0:06
about 300% annualized. My average days
0:09
in a trade is about 4 days.
0:11
>> Today's option strategy has eight legs.
0:16
Eight legs. My guest says he has done 50
0:20
of these trades and all have been
0:26
>> Thank you, John. Greatly appreciate
0:28
being back again sharing a little more
0:30
of the whole fly agonal trade series
0:33
with you. And yes, this is like a big
0:35
old spider, eight legs.
0:37
>> Yes, because we have before presented
0:39
your fly agonal strategy and today we
0:42
are going to present your flight
0:44
diagonal strategies. You know, I get a
0:46
bit messed up with these names, but you
0:48
have 40 seconds to tell us what is this
0:51
trade and how has it worked for you?
0:53
>> Sure. So basically I started with the
0:55
fly agonal which is a combination of a
0:59
call broken wing butterfly and a put
1:02
diagonal. And from that we went to a
1:06
slightly different variant, but then we
1:08
evolved to this new what we call the fly
1:11
diagonal and I think it'll become
1:13
somewhat clear when we look at the P&L
1:15
diagram of it why it's called the fly
1:17
diagonal. It's got kind of a dagger
1:19
shape to it. And and yeah, that's been
1:21
the newest variant and I've done 50 of
1:24
those and right now up until up until
1:29
100% win rate. So I I did close out a
1:33
small loser here today. But the stats
1:35
I'm going to show you that happened just
1:37
at the close of market which just
1:39
happened. So the stats I'm going to show
1:40
do not have that one included in it, but
1:43
in total transparency there was a loser
1:46
that finally came in.
1:48
>> All right, and we will get into the
1:50
details of this eight-legged trade, of
1:54
You are back for the third time, I
1:56
believe, as an interview guest on on
1:59
this show, but, you know, still, tell us
2:01
just a little bit about yourself.
2:03
>> Certainly, John. So, I've traded stock
2:05
and options for over 30 years. I have
2:08
taught for a number of different
2:10
companies, including uh Online Trading
2:13
Academy, which has a global set of
2:15
campuses around the world, Aeromir. I
2:18
worked for Kirk at Options Alpha, the
2:21
bot trading platform, helping him launch
2:23
his new platform. I also I'm assisting
2:26
uh Charles at Option Traders Assistant,
2:29
which is the main software I use with
2:31
some UI interfaces, things like that.
2:34
And I've had hundreds of students that I
2:37
have taught directly about options
2:39
trading, as well. So, I'm just I'm just
2:41
a passionate person that loves to share
2:44
ideas and concepts uh when it comes to
2:47
options trading. It's just really
2:49
>> So, let's get to your latest strategy
2:51
first. I wonder, what are you trying to
2:54
achieve with this variation?
2:57
>> Well, with all variations of the fly
3:00
agonal, the the way that it came about
3:02
to begin with was my main teachings up
3:05
until late 2024 were all about broken
3:09
wing butterflies and trading them for
3:12
income purposes and uh in faster
3:15
methods, not necessarily zero DTE, but
3:18
in shorter time frames. I I I day traded
3:21
years ago and I'm not a fan of uh
3:23
sitting at my screen all day anymore.
3:25
So, I don't do zero DTE, but I was
3:26
looking at uh trading broken wing
3:29
butterflies for income purposes and then
3:32
also calendars and diagonals. And I have
3:34
detailed classes on both of those, but
3:36
as I'm teaching those, you know, most
3:38
people know that, hey, when volatility
3:40
gets higher, you it's better to put on a
3:42
butterfly trade. When volatility is
3:44
lower, people lean toward calendars and
3:46
diagonals. And in my mind, I keep
3:49
thinking, these two need to be married.
3:51
We need to somehow find a way of putting
3:52
these together. So, in late 2024, I
3:55
started playing a lot with AI, asking
3:58
key questions of uh the the main
4:01
question basically being how can I get
4:04
faster theta decay out of an existing
4:08
options trade? And one of the key things
4:11
that kept coming back was you need to
4:13
overlap them. They they need to somehow
4:16
lay over the top of each other because
4:18
then you're getting double the theta
4:20
decay, but you're not really adding much
4:22
addi- additional risk into the trade.
4:25
So, that's what this is designed to do.
4:27
The flyagonal series of trades, there's
4:30
there's three separate trades there,
4:32
do that. Each one of them does it in a
4:34
slightly different way. The latest
4:36
version, the eight-leg version being the
4:38
fly diagonal, has a iron butterfly at
4:42
the market, and then it's got calendars
4:45
and diagonals on either side. So, that's
4:47
the latest version. And if you want to
4:49
know more about the prior version, go
4:51
check out some prior videos here on
4:54
>> Yes, we do have a a lengthy interview
4:57
about your flyagonal, and which which is
5:00
uh essentially a put diagonal below, and
5:03
it's a call broken wing butterfly above,
5:06
and this is um 8 to 10 days to
5:09
expiration type of strategy. And I do
5:12
recommend people to just check out that
5:14
interview. It will be linked in the
5:16
description, so you can have that as as
5:18
the background. But, let's get a bit
5:20
more into the details of your fly
5:24
diagonal. I need to keep my tongue the
5:26
right way here to say all these uh all
5:28
these names. So, give us a bit more
5:31
details about the fly diagonal trade.
5:35
>> Yeah, so this is where if you look at my
5:38
screen right now, I can share my screen,
5:42
uh the general concept behind it. So, it
5:45
plays through this this little uh
5:47
GIF file. So, we start off with the
5:49
butterfly in the center and then a put
5:52
diagonal and a call diagonal spaced out
5:55
and it gives us a massive wide tent. So,
5:59
and those three structures all have an
6:02
overlaying center where there's theta
6:04
decay happening at essentially a wide
6:09
range in the center of that structure.
6:12
So, again, the key here is ideally the
6:15
market's going to stay in somewhat of a
6:18
general range and if it stays between
6:20
these two outer peaks and or right under
6:24
that center peak, that's kind of an
6:26
ideal situation for us. In that
6:28
scenario, this thing decays really fast.
6:31
Now, the reason we want that thing to
6:33
decay so fast is because then we have to
6:36
or we can be in that trade a lot less.
6:39
We don't have to be in it nearly as long
6:41
when it's decaying at three times the
6:45
rate of a normal butterfly, for example.
6:48
So, that's why I think this whole series
6:50
of trades is so effective is because
6:52
we're getting that theta bomb that
6:55
occurs right at the center of that.
6:57
We're getting three times the decay in
7:00
or somewhere close to that. Depends on
7:02
volatility conditions.
7:04
And if the market does wander up or
7:07
down, we've got these really wide tents
7:10
out there to kind of catch down moves
7:12
and up moves. So, this particular trade
7:15
at this point has not needed to be
7:18
adjusted very much at all.
7:23
a stats page which I just put up there
7:25
right now. This is the stats on the
7:28
flight diagonal trade itself. Again,
7:31
I've done 50 of these personally.
7:33
Up until today, it was at a 100% win
7:37
rate, 50 out of 50. The total return
7:41
since I started doing these about 5
7:45
about 300% annualized. My average days
7:49
in a trade is about 4 days. Now, I'm
7:51
putting these on out in a
7:55
anywhere from a 7 to maybe a 14-day
7:57
window, meaning the front strikes that
8:00
are used in this structure, which you're
8:02
going to see shortly, are going to be in
8:04
around that 7 to 10-day window of time.
8:07
But, even at that, it's decaying fast
8:10
enough with that triple decay, that
8:12
theta bomb in the middle, that I'm
8:14
hitting profit targets fairly quickly.
8:17
So, the next question is, well, what's a
8:19
profit target? So, for me, the profit
8:22
target on the first day, if I'm in the
8:27
if I put the trade on last Friday, for
8:29
example, today is Monday,
8:31
I'm looking for 5 6 7% today, my first
8:37
In the on occasions, I've hit that 5 6%
8:42
on day zero. Like I opened the trade in
8:44
the morning, by the time I get to the
8:46
afternoon, it's hitting those numbers. I
8:48
go ahead and pull it off. But, within
8:54
I'm shooting for 5 to 6 7%. Once we get
8:57
outside that window, I'm shooting for a
8:59
10 to 15%. So, when it hits those
9:02
targets, I pull it off.
9:04
>> So, let's I think it would be very
9:06
useful now if I look at the specific
9:08
example of a trade where you show
9:10
exactly what strikes you do and etc.
9:14
>> Okay, so this is basically what the fly
9:16
diagonal trade looks like. And it is
9:20
an eight-legged monster. Um, but let me
9:23
break it down for you. Let me try to
9:25
make it a little bit simpler. So, what I
9:27
want to do These are, of course, the um
9:30
upper uh the calls, and down below here
9:34
is the puts. So, let me first show you
9:37
just the structure here. Let me turn my
9:39
my drawing tools back on so we can see
9:42
here that our center strikes 6890
9:45
6890. So what is that? Well, we all know
9:49
that that is a butterfly. Okay, we're
9:51
selling the center strikes here. We're
9:54
selling them in this case at the market
9:57
and then it's got 50 point wings either
9:59
side. So I can turn the two sides of
10:02
this off and on over here in this
10:04
software Option Traders Assistant. And
10:06
this software, while it's not my
10:09
company, not my software, the developer
10:11
of the software has been very very good
10:14
about modifying the software for our
10:16
particular uses in trading this
10:18
particular type of trade. The first
10:20
thing we can see is that this portion of
10:22
the trade, like I said, this is the
10:24
butterfly. Pretty standard butterfly.
10:27
>> An iron butterfly where you sold both
10:29
the call and the put
10:30
>> this is an iron butterfly. Correct. Good
10:32
point because the prior fly diagonals
10:35
are using call butterflies. So the
10:37
reason for the iron butterfly here is
10:41
uh well, I should say the prior ones,
10:43
the call butterfly also isn't centered
10:46
at the current market. So this one is
10:48
centered at the current market and it
10:51
the reason for that is that's where you
10:54
get your absolute most premium out of a
10:59
trade is you're going to sell those
11:01
center short strikes. So
11:04
that's the butterfly portion of it.
11:06
Separate from that is the diagonal
11:09
portion. So it's essentially a double
11:12
diagonal. And I've traded both of these
11:14
structures for years,
11:16
you know, many years. And I always again
11:19
tended to lean toward, oh well, when
11:21
it's lower volatility, you put on the
11:23
diagonal because it's positive Vega. So
11:27
if the volatility expands, it's it's to
11:30
be good for this trade. And the
11:32
butterfly, you want to put on in lower
11:34
volatility. Or excuse me, you want to
11:36
put on the butterfly in higher
11:37
volatility because when volatility
11:39
shrinks, that's good for it. Well, what
11:42
if I don't want to sit there and try to
11:43
figure out is volatility higher or lower
11:45
right now? Is it going higher? Is it
11:47
going lower? I don't know. Uh so, let me
11:49
put on something that covers both sides
11:52
of the volatility equation.
11:54
And basically, one side kind of
11:56
neutralizes the other from a volatility
11:59
standpoint. That means two key things.
12:02
One, I can put this trade on anytime I
12:04
want. I don't need to sit and wait for
12:07
volatility to be higher or volatility to
12:09
be lower. It It works well in all those
12:13
environments. So, I'm pretty much
12:15
agnostic. I'm not waiting around
12:18
>> So, how many days out have you put this
12:22
>> This one right Oh, this one right here
12:24
is a little further out than normal. I
12:26
just modeled one up here. This one is
12:28
modeled out at 32 days expiration. So,
12:31
and again, I often do these in the the
12:34
10- to 12- 14-day window, even a short
12:37
as 7-day window. Um I I just chose to
12:41
model this one a little further out. One
12:43
of the reasons that I get into in my
12:45
classes on going further out is if I
12:48
want something that's maybe going to
12:49
move a little slower,
12:50
uh like one of my students just left for
12:52
a trip to New Zealand for 3 weeks. He
12:54
still wanted to trade, but he didn't
12:57
know that he'd be able to look at his
12:58
screens every day. Well, if you just go
13:00
further out in time,
13:03
you get even a wider tent, and the T0
13:06
line stays flatter for longer. So, if
13:09
you go two or three days and you don't
13:11
have a chance to look at it, uh unless
13:13
the market makes a massive move, it's
13:16
>> How does this trade develop as time
13:19
passes? Because now now you're showing
13:21
us you've set it up, right?
13:23
>> Yeah, so so this is the basic setup of
13:26
the trade here. Again, as you know,
13:28
we've got the butterfly in the center
13:30
and then we've got the two diagonals out
13:32
on either side. And then really what
13:35
we're looking to have happen over time
13:37
is we've got a pretty sizable amount of
13:40
theta working here. Of course, if we go
13:42
shorter days to expiration, this theta
13:45
is going to be higher. It's going to
13:47
decay faster, but we're going to be a
13:50
little bit narrower and therefore our T0
13:54
line is going to mound up a little bit
13:57
faster giving us a little more gamma.
13:59
So, what I teach my students is if
14:02
you're wanting to be a short short-term
14:05
trader and you're willing to sit at a
14:06
screen, we'll put these on two, three,
14:11
If you are working full-time and you
14:14
might not be able to look at these for a
14:16
day or two, then go further out in time.
14:19
It's an equally effective trade. The
14:21
further you go out in time, the wider
14:23
your tent will end up being, the flatter
14:26
the T0 line will end up being, but
14:28
basically we're just looking for this
14:30
stated decay to kick in and this thing
14:33
will, you know, over time pretty quickly
14:37
in most cases, get to that 10% mark and
14:41
just take the trade off.
14:42
>> You said that that the iron butterfly
14:45
and the diagonals are kind of
14:46
neutralizing each other when it comes to
14:49
volatility. Is that actually something
14:51
you aim for to get like the Vega around
14:54
zero on the total trade?
14:56
>> I I don't necessarily shoot for that. I
14:58
mean, it's not like I'm coming in here.
15:00
We can see that the we've got positive
15:02
Vega of 11 on the double diagonal side
15:06
and then we're going to have negative
15:08
Vega of 19. Am I trying to structure
15:10
this in a way that totally neutralizes
15:12
Vega? No, I'm not. And the reason that I
15:15
don't worry too much about that and I
15:20
as you probably know, I it it's just
15:23
impossible to go too far down this
15:25
rabbit hole, but just because a trade
15:28
models as positive Vega
15:31
does not mean it always acts that way,
15:33
particularly with calendars and
15:35
diagonals. It all depends on where
15:38
volatility comes in. Does it come in on
15:41
our our front period strike, or does it
15:43
come in on the later period strike? And
15:46
there's no way of really knowing that.
15:47
So, that's a long way of saying that
15:51
while this shows positive Vega, I don't
15:54
necessarily count on it acting as
15:58
positive as it shows, and therefore
16:00
there's no sense in me trying to balance
16:02
those things out. I mean, they do
16:06
certainly to an extent, but am I trying
16:09
to go in there to get a precise number
16:11
here that takes this to some specific
16:13
number? No, I'm not. I'm just relying on
16:15
the two structures to generally act the
16:18
way they're supposed to.
16:19
>> Let's get a little bit more into the
16:21
details of your entry mechanics. What
16:25
are the underlying so use here? You said
16:28
a little bit about DTEs, but can you be
16:30
a bit more specific on that part as
16:34
>> Yeah, so on all of the fly diagonal
16:37
series, they are built around
16:40
predominantly doing a Friday to a Monday
16:43
expiration. So, in other words, all of
16:46
the front period strikes
16:49
will end up being on a Friday date. And
16:57
will often be on the following Monday.
17:00
They don't have to be. They could be. If
17:02
you're trading something, for example,
17:03
let's say you're trading this in Tesla.
17:05
I've traded this in a lot of underlines.
17:07
I've done it in SPX is my main vehicle,
17:10
for sure. I've done it in spy. I've done
17:12
it in the queues. I've done it in IWM.
17:14
I've done it in Tesla, Microsoft. Um,
17:16
anything that's highly liquid. So,
17:20
but not all of them have Monday
17:25
I always have the front side is always
17:28
going to be a Friday.
17:30
The back side or the further dated might
17:33
be the following Monday, might be the
17:37
That can vary depending on the
17:39
underlying. But the reason for that is
17:43
as most people probably know if you've
17:45
traded for any period of time, the
17:47
market makers tend to kind of spike up
17:50
the Friday volatilities a little bit to
17:52
carry them through the weekend. It's
17:54
kind of a little bit of a buffer. I want
17:56
to take advantage of that buffer. So, if
17:58
I'm going to sell short strikes here,
18:02
I want to sell them not only at the
18:05
money, but I want to sell them on a
18:06
Friday expiration because those tend to
18:09
usually be elevated a little bit anyway.
18:11
It helps me get a little bit of what
18:14
people sometimes call backwardation.
18:16
>> I want to go back to your example. You
18:19
said that you put your iron iron
18:22
butterfly was put at the money with a 50
18:26
wings. But but then the diagonals, how
18:30
much further out do you put that?
18:33
Let's take this trade here for instance.
18:35
How how much further out have you put
18:38
>> Right. So, basically I usually go an
18:41
additional 50 points or excuse me, yeah,
18:44
an additional 50 points on those. So, in
18:47
other words, I have looking at the call
18:49
side, I've got my short strike at at the
18:52
money. My long strike is 50 points
18:57
Then I go out and I sell my short strike
19:04
roughly 50 points higher than that. This
19:07
is not exactly 50 points in this case.
19:10
The reason for that is over here on my
19:13
long side, once you get out a certain
19:16
distance, you don't necessarily have
19:18
strikes every five points. In this case,
19:20
we only have them at 25-point
19:22
increments. So, I I basically adjusted
19:25
this a little bit. Um I I could go out
19:28
in fact actually this is probably just
19:30
fine. So, I'm 50 points higher here.
19:33
And then I'm usually 20 points
19:38
to here, but I don't have a 20-point
19:40
increment because again that doesn't
19:41
exist out there right now. But my goal
19:44
is to essentially be delta neutral. By
19:47
delta neutral, I you know, I don't care
19:52
you know, one or two, negative one or
19:54
two, it's not that precise. I just want
19:58
to be somewhere around delta neutral. I
20:00
don't want to be 10 positive delta or
20:03
anything along those lines. And so yeah,
20:06
that's that's essentially what I'm
20:07
looking for. And then the same is true
20:08
on the downside. On the downside, I tend
20:10
to go 50 points and then the distance
20:13
from here to here will usually be 20
20:15
points. If I want a less expensive
20:18
trade, in other words, this is going to
20:20
carry roughly $3,000 in buying power,
20:23
$3,000 in risk on entry. If maybe I was
20:27
a little concerned about
20:29
having that much risk in the trade, I
20:34
basically just do a calendar
20:37
on either side. Now that would, I'm not
20:39
sure why it showed going up there. I'd
20:41
have to bring it in on the other side
20:43
too, but I can narrow the difference
20:45
here in these points because these to
20:47
some extent are acting like a a
20:49
vertical. So, I could basically change
20:53
them around a little bit. I take that
20:54
back. Obviously moving that down is
20:57
going to bring Yeah, I don't even have
20:58
strikes higher. But I can adjust these
21:02
change the buying power I'm going to be
21:03
using here is basically what I was
21:05
trying to say. But since I only have
21:07
50-point increments here
21:10
or 25 points and then 50 points, there's
21:12
just not much I can do with this.
21:13
>> Let Let's repeat your rules for when you
21:18
>> My goal is that within the first day
21:21
that I put the trade on. So, in other
21:23
words, and the next question is going to
21:25
be, "Well, do you put these on in the
21:26
morning? Do you put these on in the
21:27
afternoon?" Doesn't make a difference. I
21:31
of the fly eagle trade series, I've done
21:34
a couple hundred over a couple hundred
21:36
of them now, and I analyze all of those
21:39
with AI as far as days of the week, time
21:42
of day I put them on, all sorts of
21:44
information like that. Uh
21:46
Again, 250 or so trades isn't a massive
21:52
uh anything that it did show, I don't
21:53
know that I would consider statistically
21:55
valid. But, I'm not finding any
21:57
indication that says, "Hey, morning's
21:59
better, evening's better, Monday's
22:01
better, Wednesday's better." But, back
22:03
to your original question of uh the
22:06
profit taking, so if I put one of these
22:09
on in the morning, um and it hits a 4-5%
22:12
by the close of the day, I'm going to go
22:14
ahead and shut the trade down. I'll take
22:16
5% in a day, all day, every day, because
22:19
that ends up being over 3,000%
22:23
And that's after commissions, by the
22:25
way. So, that's okay. Yeah, exactly.
22:28
Exactly. I'll I'll do that all day,
22:30
Um but, if we roll into a subsequent
22:33
day, still on day one, what I call it,
22:36
day zero is the day I open it. On day
22:38
one, if I can attain those same
22:40
objectives on day one, yeah, I'll go
22:42
ahead and pull the plug. I'll take my 5,
22:47
After day one, then I'm waiting, looking
22:51
at getting to uh somewhere in the
22:53
neighborhood of around a 10 to 12-15%
22:57
profit target is what I'm shooting for
22:59
after for original opening.
23:02
>> Okay, but I guess that these trades
23:04
don't always develop as you want. And
23:07
sometimes they get into negative
23:11
You said you only have winners so far,
23:13
but I still have to ask you, when are
23:14
you planning to take a loss?
23:17
>> Uh in almost all of my options trading,
23:23
doesn't close out at a loss. Doesn't
23:25
mean I don't take a loss, but I don't
23:27
run stops on my trades, okay? And rather
23:30
than a stop, I use defined risk trades
23:33
to begin with. So, I know that this
23:36
trade, if I were to enter it right now,
23:38
has $3,000 in risk associated with it.
23:42
And that is worst-case scenario if the
23:44
market absolutely tanked and I never
23:47
adjusted the trade. One of the things
23:49
that every option trader needs to know
23:52
is how to effectively adjust your
23:54
positions. Because I've taken the time
23:56
to learn how to properly and effectively
23:58
adjust positions, more often than not, I
24:03
uh if a trade gets into trouble, if a
24:05
trade gets into negative territory,
24:07
particularly to the downside, I can
24:10
usually heal that wound. So, I will go
24:13
ahead. There's adjustments you can put
24:15
on, and I spend hours on adjustments in
24:17
the courses and things, but adjustments
24:19
you can put on that basically will allow
24:22
the trade to recover in most cases. Now,
24:25
specifically when I'm trading SPX,
24:27
regardless of what structure I'm
24:29
trading, whether it's a condor or
24:31
butterfly, which quite frankly, I don't
24:33
trade anymore unless they're in a flag
24:35
configuration. But, um I don't take
24:38
stops because uh stops, specifically
24:42
mechanical stops, when you get a hard
24:44
fast move in the market, up or down, uh
24:48
a lot of the market makers start
24:49
standing back, and and the market just
24:51
kind of dries up. Bid-ask spreads will
24:53
get really, really wide, and if I have a
24:56
stop order out there that just gets
24:58
activated in the market,
25:00
I am going to get crushed on that
25:02
bid-ask spread. My loss is going to be
25:05
significantly larger than what it showed
25:08
on paper by the time I get filled. So,
25:11
for that reason, uh I do not use stops,
25:14
at least not mechanical stops. I don't
25:16
use stops of any type. I look at the
25:18
position after the market's moved, it
25:21
will be down, I'll decide what is an
25:23
adjustment technique that I might make
25:25
on that trade, and I'll go ahead apply
25:28
an adjustment, and that in many cases
25:32
can bring the trade back to a lower
25:34
level of profitability, or at least
25:37
reduce losses in the trade. So, that's
25:40
usually what I do as opposed to taking a
25:43
>> So, let's be specific about this. Let's
25:45
say the market makes a big fall down,
25:48
and this trade gets into trouble. What
25:51
are the ways you can use specifically
25:53
then to adjust this trade?
25:56
>> There are a lot of different ways when
25:59
you're dealing with eight legs. So, um
26:02
for in the course, I kind of categorize
26:05
I've got at least five different
26:08
downside adjustments that I recommend
26:10
students go through to try to determine
26:13
which one's going to work best. Now, it
26:15
depends on how early you are in the
26:18
trade. If if you're brand new and early
26:20
in this trade, there's certain things
26:22
are going to work better than others. If
26:23
you get later in the trade, your you're
26:27
more limited as to what will work. But,
26:30
some of the standard things that you're
26:31
going to do, if the market, let's just
26:33
say right now, if the market were to
26:35
move down significantly, some of the
26:37
first lines of defense that I look at is
26:40
I'll move my calls, my short calls,
26:43
If I take some of the short calls that
26:45
are in this structure and I move them
26:47
lower, I'm picking up premium. I'm able
26:50
to sell the the um or buy back my short
26:54
calls for less profiting on that and
26:56
then I go down and I sell them closer to
26:58
the current market. That brings premium
27:01
into that trade and that's going to you
27:02
know, tilt my tent open it up a little
27:05
bit to the downside.
27:06
>> Is it a short call both in the these are
27:08
the short calls both in the butterfly
27:10
and the diagonal that you would move?
27:12
>> I I will model I will model both of them
27:15
and I'll see which one gives me the most
27:19
picture if you will. And what I'm
27:21
looking for in a favorable picture by
27:23
the way is I want something that's going
27:26
to keep my theta levels high. I want
27:29
something that's not going to force me
27:32
to add too much additional buying power
27:34
or risk into the trade. So those are the
27:38
kind of my main caveats when I look at
27:41
making that adjustment is you know, what
27:44
adjustments can I make that aren't going
27:48
to introduce a whole bunch more buying
27:50
power. You're going to have to introduce
27:51
some, but not introduce a massive amount
27:53
of additional buying power and something
27:55
that's going to keep my theta high. And
27:57
the standard moves again are going to be
27:59
move some of the short calls down and
28:02
I'll model the different ones, you know,
28:03
which ones do I move down and that's
28:06
also going to vary a little bit based on
28:10
my perception of the market, where I
28:12
read the range of the market. Now this
28:16
this strategy does not require
28:18
technical analysis for the most part.
28:21
It's not like you're day trading and
28:22
you're looking at 5-minute bars etc.
28:25
I am looking at a market range that's a
28:28
couple hundred points, 300 points wide
28:30
and I'm picking out where there might be
28:32
support and resistance and it it doesn't
28:37
have to be very precise at all, but if
28:39
for example, I'm taking heat to the
28:42
downside, the the market's moving down,
28:45
my trade might be down a little bit of
28:47
money at that point. Um before I make an
28:50
adjustment, I'm going to go out and I'm
28:52
going to take a look at the chart and
28:55
I'm going to see, well, are we coming
28:57
down to an area that might represent
28:59
some support? If we are, I might hold
29:01
off a day before I go and make any
29:04
>> Moving down the calls is one way. What
29:06
could be other ways?
29:08
>> Another way, if you get a massive gap
29:10
down, let's just say again, this one
29:12
that I modeled up, I'm just taking a
29:14
look at it here. So, it's centered at
29:18
Uh if our market moved down, let's just
29:20
say we got a 200-point drop here. So,
29:23
we're down here to 66
29:25
you know, 80, somewhere down in here. A
29:27
couple things are going to happen. First
29:29
of all, our market drops down to here,
29:31
volatility is going to increase on that.
29:34
And if volatility increases, our tent
29:37
will usually widen out. Okay? So, that
29:41
6680 or whatever, well, gee, we're only
29:44
down 128 bucks if the market goes down
29:47
there. Based on Black-Scholes options
29:50
modeling, which again, it may not play
29:52
out exactly like that. But that's why
29:54
the downside move, in my perspective, is
29:57
not the one that I fear. This trade
29:59
handles downside moves really well. It
30:02
handles increases in volatility really
30:04
well. But all that said, so let's just
30:07
say we get that big downside move and
30:10
volatility picked up. Well, a couple
30:12
things that I could consider, I may
30:15
choose to come down because if
30:17
volatility picked up, um we're probably
30:20
going to have some backwardation down
30:22
here. So, what do I mean by
30:23
backwardation? If I come and look at
30:25
volatility, now we're not going to see
30:27
that here right now, just to be clear.
30:29
Yeah, there actually is a slight amount,
30:30
but if we came down below the market
30:34
and we had a little bit of
30:35
backwardation, I would just add in
30:39
a whole new diagonal down there.
30:42
And that you can see just widens this
30:44
whole structure out immensely. And it
30:46
would widen it out even further
30:49
if we had more backwardation here.
30:52
>> What what do you mean by backwardation?
30:54
>> Backwardation is where the front
30:57
volatility, in this case is 1799,
31:00
is the IV on the front period here
31:04
versus the back period is 1760. So, that
31:08
is actually a little bit of
31:09
backwardation. When the front volatility
31:12
is higher than the back volatility. The
31:14
more that happens, if I'm selling
31:17
something as an option seller, I want to
31:20
sell something that's highly valued. I I
31:22
want to sell the higher-valued stuff.
31:25
And buy the lower-valued stuff. So,
31:27
that's kind of what you're doing here.
31:29
That's an ideal situation for making an
31:32
adjustment. It It actually is um
31:36
when the market moves to the downside,
31:38
your toolbox opens up.
31:40
And you can see how that changed this
31:42
whole structure of this tent. It
31:44
increased my theta decay. It made it a
31:46
whole bunch wider. So,
31:49
downside adjustments are easy to model,
31:52
easy to plan, um easy to implement.
31:56
>> But, we had recently a big jump up in
31:58
the market. And I get from what you are
32:00
saying that that's actually the type of
32:02
situation you don't like.
32:04
>> That that is the type of situation I
32:08
I should say that there are ways of
32:11
modifying this trade a little bit. If I
32:14
had a or if I had an inclination that
32:17
hey, we are in a really super bullish
32:19
mode. Now, I'm not talking just a a
32:21
drift up of a couple hundred points over
32:23
a week. That that doesn't make any
32:25
difference. This handles that just fine.
32:28
But, when you look at our markets here
32:32
9 days, and we are up over 10% in 9
32:36
days, one of those being a 3% gap up,
32:40
that is somewhat unheard of territory. I
32:43
mean, you've only had a move like that
32:45
maybe once every 3 4 years, and it's
32:48
usually after a big drop like in COVID
32:52
era, you had massive massive drop, and
32:54
then the Fed comes out and announces a
32:56
bunch of stimulus, and then the market,
32:58
you know, rips back up. On those days,
33:00
we did have uh I believe one of those
33:02
days was a 10% gap in a day. So, that is
33:07
not a favorable situation for this
33:09
trade, but they don't happen very often.
33:12
>> Okay, but what can you do what would you
33:14
do if it let's say maybe not 10%, but if
33:17
you had like a big jump here, it goes
33:19
beyond your the short on your diagonal
33:22
call diagonal. What what would you do
33:24
>> So, similar similar uh moves, or I
33:28
should say the opposite move. So, if the
33:31
market starts moving up, one of the
33:33
standard moves is that I would take my
33:36
short puts, and I would move those a
33:39
little bit higher. And we can see if I
33:40
move those higher, that opens up this
33:43
upside here a little bit. So, I've got
33:46
my risk is a little further out, and my
33:48
risk is a little less if this thing
33:50
gaps, you know, all the way up to here.
33:53
Now, the difference though is
33:57
anytime you're adjusting an options
33:59
trade that's going against you to the
34:01
upside, this is true of butterflies,
34:03
this is true of calendars and diagonals,
34:05
it's true of condors, you're not getting
34:07
as much premium when you go to make that
34:10
adjustment. So, it's a little bit harder
34:13
to do, and not harder. Um I mean, it
34:17
it'll still execute, it will still fill
34:19
just fine. You're just not getting a
34:23
um to make that adjustment. So, the
34:26
adjustments become a little more
34:27
expensive. You're getting a little more
34:29
tied up into that trade at that point
34:31
than what you would have to do in a down
34:33
move. So, down moves are are easy peasy.
34:37
These big up moves, again, a grind up,
34:40
not a problem. These big up moves
34:42
represent more of a challenge just
34:44
because any move I would make to try to
34:47
bring extra premium into this trade, I'm
34:49
just not going to get the extra premium
34:50
because volatility is low at that time.
34:53
>> And uh that big jump upward also
34:56
typically lead to a big drop in
34:58
volatility. And diagonals are not doing
35:01
are not doing very well in big drops in
35:03
volatility, are they?
35:05
>> Uh no, the diagonal doesn't do as well
35:07
in a big drop in volatility. And again,
35:10
the bigger part is the
35:13
if we stay generally within a couple
35:17
hundred points of where this trade is
35:19
put on. Again, here we're 6880.
35:22
I mean, if we go up to, you know, 7,000,
35:26
7100, 7500, whatever. So, you've got a a
35:30
couple hundred point range there that
35:32
you can float back and forth in, and
35:34
this thing is going to decay very nicely
35:37
in there without too much difficulty.
35:39
It's that big gap up that you then start
35:44
to take heat on the upside. And while
35:46
you can adjust that out as well, you can
35:49
do different adjustments like you just
35:51
saw me do, you don't get nearly as
35:55
to make that adjustment. You don't get
35:57
as much premium coming in, so it's more
36:00
difficult to write the ship, so to
36:02
>> And I guess this is the worst that can
36:04
happen with this strategy. Is that so?
36:06
>> I wouldn't call it the worst. This is
36:08
would be what I would call the second
36:10
worst. And and again, fortunately, this
36:12
does not happen very often. Right now,
36:14
this move that we're having is, you
36:16
know, there hasn't been a move like this
36:18
in years that has been this sustained,
36:22
this fast. But the worst,
36:26
it's it's important. I'm just doing a
36:28
video right now that's going to be added
36:30
to the course that specifically talks
36:32
about what breaks the fly agonal series
36:35
trade. It's important that every trader
36:37
know, no matter what you're trading, you
36:39
need to first look at the worst case
36:41
scenario so you understand that.
36:45
>> Well, the worst case scenario on this
36:47
one is what I call the whipsaw and it
36:49
happened in COVID and why that's worse,
36:52
it happened in COVID and it happened
36:54
more recently in the tariffs on tariffs
36:57
off situation last year.
37:00
And both of those, I mean our market
37:04
15, 20% in a period of a couple days
37:08
and and that's fine. That big down move,
37:12
I can adjust for that. I can add in
37:14
calendars. I'm getting a premium. We've
37:18
Everything's good. I I got no problem
37:20
with that at all. So and most traders
37:22
fear the heck out of that. I'm perfectly
37:24
fine with that because I know these
37:26
adjustment techniques. The worst case
37:28
scenario there is we get that big move
37:31
down and the market starts to stabilize
37:33
a little bit and I've put on all my
37:35
adjustments, my my new tent structure
37:38
is, you know, right down around where
37:39
the market is now and lots of theta
37:42
decay, everything's rosy and then we
37:45
decide, oh well, tariffs are off. I
37:48
solved the problem. And then the market
37:50
rips back up right through the newly
37:54
established tents you've created. So in
37:56
that scenario you're basically getting a
38:00
double whammy if you will because you
38:02
you paid money to make your adjustments
38:04
when the market went down. You had to
38:06
give up something in order to reset your
38:09
tent. So you've reset your tent, you've
38:12
you've paid to pick up camp and move to
38:14
a new location and that new location is
38:17
great and then all of a sudden it's on
38:20
fire as the market's ripping back up and
38:23
then you need to chase your tail and go
38:26
back to the other side. So, that's the
38:28
worst case scenario and that's not
38:30
unique to this trade. Any sort of Delta
38:34
Theta positive condor butterfly whatever
38:38
is going to suffer that that same fate
38:41
in that type of market. I'd say this one
38:44
suffers it less than those others do,
38:47
but that is the worst case scenario, but
38:49
fortunately I went back last 20 years
38:52
we've had seven events like that.
38:54
>> We we have presented a fly diagonal
38:56
strategy earlier and this is the fly
39:00
I'm just curious about how what do you
39:01
think are the pros and cons of those two
39:03
if you are to compare those strategies?
39:06
>> Yeah, so great question and I would say
39:09
that the fly diagonal interesting again,
39:12
there's three variations of this just
39:14
recently I took all the results from
39:16
well first of all, I fed the P&L
39:18
diagrams like what you've already seen
39:20
for all three of them. I fed them to
39:22
three separate AI's.
39:26
uh let's see I use uh chat GPT, I use
39:30
Gemini and I use Claude at this point.
39:32
At one point I also use perplexity, but
39:34
those are the three I fed all three of
39:36
them these P&L diagrams on the sample
39:39
trade like hey, if I'm going to enter
39:40
this trade right now, this is what it's
39:42
going to look like. Tell me where
39:44
they're going to break. Tell me where
39:45
I'm going to run into problems. Tell me
39:47
which one you like and why. All three
39:49
AI's agreed fly D was the best as far as
39:54
the it is the more expensive one to
39:56
enter as far as buying power, but it's
39:59
the best because it has the widest tent
40:01
fastest Theta decay, etc. All three were
40:03
in agreement on that. All three also
40:06
said the original fly diagonal which if
40:08
you go back and watch our prior video
40:11
while it did phenomenal and it's at a
40:16
all three said "Retire that one."
40:19
That that one is has been replaced by
40:22
the fly B variant and the fly D.
40:25
So, and and the reason is the only
40:28
reason it gave for using that original
40:30
one. The original one is the least
40:31
expensive to enter. It requires the
40:33
least amount of buying power because it
40:37
one side that has a diagonal in it and
40:40
diagonals are more expensive.
40:43
>> So, that's just to make it clear for the
40:45
audience. That is a put diagonal on the
40:47
downside is a call and broken wing
40:52
>> And your plan in your fly angle B, what
40:55
what what was that again?
40:56
>> So, what what's different with the B is
40:59
the very first adjustment we would
41:01
always make when the market moved up
41:03
with the original variant is I would
41:05
take the very upper long call in the
41:08
butterfly and I would move it out to the
41:13
So, that would be an adjustment we would
41:15
normally make if the market started
41:18
moving up on us. Well, as we were having
41:20
this non-stop kind of slow grind up
41:22
market over the past year, it's like,
41:25
"Why don't we just start there?"
41:27
So, we started analyzing just starting
41:30
there. That would be our starting
41:31
position for the trade and it it has
41:34
higher theta so it decays faster. It
41:36
does cost a little more to enter.
41:39
So, these three variants to get back to
41:42
the analysis part, I then took all of
41:45
the trades that I've done and I've got
41:48
roughly 100 of the original variant.
41:51
I've got about 60 or 70 of the B's and
41:54
I've got 50 of the D's. I fed all of the
41:57
files into AI and had it analyze those
42:01
and the results actually came back
42:03
exactly as they had predicted. So, it
42:05
was kind of interesting because I asked
42:07
all the AIs just based on this P&L
42:09
diagram, what would you expect? After I
42:11
got those results, I fed in all of my
42:16
AI was right in its assessment and
42:18
basically said the only reason to use
42:20
the A variant, the original, I I say A,
42:23
it's actually O for original. Confusing.
42:26
The only reason to use the original
42:28
variant is if you want a lowest cost to
42:31
entry. It's going to have the narrowest
42:33
overall range to it. It's still 150
42:36
points wide, but it's going to have the
42:38
lowest overall range.
42:40
The B, which is that widened out uh
42:50
mid-range width of a tent,
42:53
faster theta decay than the original,
42:56
and then the D variant has the
43:02
it is a little more effective in higher
43:06
volatility environments
43:08
because we're selling the two strikes
43:12
Now, I've been using it even in this low
43:14
volatility environment and it works
43:16
fine. Obviously, with 50 winners out of
43:18
50 trades, uh it has performed fine, but
43:21
I will hit my profit targets faster
43:26
that trade when volatility is higher.
43:29
>> Okay, there are a lot of different
43:31
variations here and a lot of facts to
43:33
keep uh track of, but I do recommend uh
43:36
the audience to watch the interview you
43:39
did with you about the original fly
43:41
diagonal trade. But, you know, I always
43:47
place your Please place your strategy on
43:49
a risk profile scale from one being very
43:52
low risk to 10 being very high risk.
43:55
Where would you put this latest
43:57
variation, the fly diagonal, uh on such
44:00
a risk profile scale?
44:05
I guess I would say it depends on your
44:12
no, it doesn't depend on your level of
44:13
experience. That's probably not a way a
44:16
good way of putting it. It is a defined
44:17
risk trade. And at the end of the day,
44:21
if you wanted to trade this in spy, you
44:23
can enter this trade for a max risk of
44:29
I feel like that question, particularly
44:32
when you're dealing with defined risk
44:34
trades, puts a defined risk trade
44:36
automatically in the lower half of that
44:38
scale. You know, if I were trading a
44:40
naked strangle or something, I would
44:43
probably one of the higher risk trades
44:45
you can do. So, just the sheer fact that
44:47
this is defined risk, I think certainly
44:49
puts it to the lower end of that scale.
44:50
And if I remember your scale, John, it
44:52
was 1 to 10 and and with one being the
44:58
>> Maybe three, four, somewhere in that
45:01
general range. And I think you also have
45:03
to factor in the massively high win
45:05
rate. I mean, with a 95% win rate over
45:08
the entire fly angle series,
45:11
you're also pretty low risk just because
45:14
of the high win rate.
45:15
>> Steve, you you had touched on this in
45:17
the beginning, but let's get back to
45:19
your results of trading this strategy so
45:22
far with 51 trades, if I understand it
45:26
>> Well, that that's not totally correct.
45:29
So, this that specific strategy, yes, 51
45:32
trades and 50 out of 50 winners up until
45:36
just yesterday. Uh that said, I
45:40
those were my personal trades. I think
45:43
it's probably more meaningful to show
45:45
you the trades that I actually share
45:46
with students in the alert service.
45:48
Let's take a look. I've got actually
45:50
some results that I've pulled together
45:52
here. And to be clear, these aren't the
45:54
results on just the fly diagonal. These
45:56
are the results, which I consider to be
45:58
a little more important because these
45:59
are all in my alert service. They were
46:02
all shared with the students, but a
46:03
couple things to note here. First of
46:05
all, this is August of last year is when
46:07
I started doing this.
46:09
These are the results during that period
46:11
of time, and this red line here is the
46:14
SPX. So, we can see while the SPX is up
46:17
a little bit over this period of time,
46:20
um the results of the service is up
46:22
significantly more with all of the
46:25
various fly agonal trades. And again,
46:27
I'm I've traded all three variations in
46:30
here. I share all three variations. 100%
46:33
winning months. This is the profit by
46:36
month. Uh 95% win rate. A 6.98
46:42
of the um profit factor. Average days in
46:45
trade 5.2. Now, remember the prior
46:48
diagram we looked at was 4.1. That was
46:51
specifically the fly diagonal version of
46:53
the trade. So, this is all of them
46:59
required no adjusting. And the win loss
47:03
streak I like to look at. Well, there
47:04
were 31 wins in a row. That's I'm on
47:07
that streak right now.
47:09
Uh winning or losing trades in a row,
47:12
the streak has been one. And it happened
47:14
a couple times. We can see down at the
47:17
bottom here. This is the uh number of
47:20
weeks winning. There have been two
47:22
[clears throat] losing weeks in there.
47:23
So, one other thing I'd like to share.
47:25
This is my Trade Year account. Now, this
47:27
is a smaller account that I set up
47:29
specifically just to trade the fly
47:31
agonal series in. I started back in July
47:35
here, and this trades or this account
47:37
started with about $28,000.
47:40
And now, as of April 6th actually is
47:43
when I took the screenshot, uh I had
47:46
grown that to $59,000. So, that's about
47:48
a 106% gain in roughly 9 months or about
47:54
So, and I it's It's that amount now. I
47:56
haven't traded it as consistently over
47:58
the last week or two, but I wanted to
48:01
provide this because these screenshots
48:03
of that P&L diagram, if any of you have
48:05
Trade Year, you know that it shows right
48:08
web login on the upper right. So, these
48:10
are taken directly from there. So,
48:13
again, the the performance has been
48:16
in my 30 years of trading, I've never
48:18
seen anything perform like this trade.
48:21
As we always say with options trading,
48:24
uh past results do not reflect future
48:27
results, or whatever that phrase is.
48:29
John, I'm sure you'll get to it. You'll
48:31
probably be saying it a little bit later
48:34
But, one of the things I like to do with
48:36
students is I want to make sure, as I
48:38
mentioned earlier, that when you look at
48:39
a trade, the first thing you look at is
48:41
what's the worst-case scenario. What do
48:44
Where is this thing going to break, and
48:46
how bad's it going to hurt when it
48:47
breaks? And that's my job is to make
48:50
sure people understand that,
48:53
and then they can decide what to do with
48:55
>> Let's uh sum up. What are the two or
48:59
takeaways that you really would like the
49:01
audience to remember from this
49:04
>> Wide range, no matter which one of these
49:06
you use, wide range,
49:09
theta bomb. So, I have people that trade
49:13
other different strategies, not to take
49:15
anything away from other strategies, but
49:18
we all know some of the names out there,
49:23
um M1, um there there's a bunch of
49:26
different other trades out there that
49:27
have unique names. The vast majority of
49:30
them just have a single structure that's
49:32
decaying, providing that income. The
49:36
fact that the fly diagonal series,
49:39
based on, quite frankly, AI helping me
49:42
assemble this, has multiple, either two,
49:45
or in the case of the fly diagonal,
49:46
three different structures, all
49:49
overlapping, providing decay at the same
49:51
time. So, I'd say there's really two.
49:58
theta bomb. And I guess if I were to
50:01
toss a third one in there,
50:03
I would say rinse, wash, repeat. In
50:05
other words, our goal is to not have to
50:08
adjust many of these, get out of them
50:10
quickly, capture your 5 10%, which
50:13
again, if you capture that in 3 4 5
50:16
days, that's over 1,000% annually, and
50:20
>> And what would be good sources to learn
50:23
more about these kind of trades
50:26
and kind of structures?
50:29
>> Uh if you're talking about these kinds
50:31
of trades and structures meaning
50:33
butterflies, calendars, and diagonals
50:36
separately, there's lots of different
50:38
sources out there. If you're talking
50:39
about the flyagonal series specifically,
50:43
uh I'm your guy. I'm I'm the one that
50:44
kind of developed it, if you will, and
50:47
have uh promoted. I'm sure there's other
50:49
people that have put these structures
50:51
together over time. I think what's a
50:53
different here is first of all, AI did
50:57
help me figure out how to best assemble
51:00
them from a strike standpoint, etc. by
51:03
doing lots of back testing and analyzing
51:05
of my trades. And I think the second
51:08
piece of the puzzle here is that we have
51:10
a piece of software. It's not my
51:12
software. I got no stake in the company,
51:14
etc. But the software has been developed
51:16
in a way and that it allows you to
51:19
manage these. So, I think that's why
51:22
while people may have done trades like
51:24
this before, I don't think anyone has
51:26
really gone to the energy of promoting
51:28
them or uh put them out there as an
51:31
actual profit engine, if you will,
51:34
because they've just been too hard to
51:35
manage in the past. But uh Charles
51:37
Option Traders Assistant helped me solve
51:39
that problem, and we have that tool in
51:43
>> Steve, thank you very much for once once
51:46
more coming back to Theta Profits and
51:49
discuss one of your strategies and this
51:51
this was a follow-up of the first
51:54
interview I did with you about your Fly
51:56
Diagonal and this is
51:59
next development of that strategy that
52:02
you just launched and brought out there
52:04
and it was really inspiring
52:07
to learn about this and of course
52:09
a lot of the secret I guess is is in the
52:14
I do recommend people to watch the first
52:16
interview we did with you. The link is
52:19
popping up on the screen right now.
52:21
Thank you very much Steve for for
52:24
sharing your knowledge with us.
52:26
>> Thank you so much. I really appreciate
52:28
it and if anybody has any questions,
52:31
feel free to email me
52:32
steve@optionsincomeacademy.com.
52:35
I love hearing from people. Thank you
52:37
John, I appreciate it.