0:00
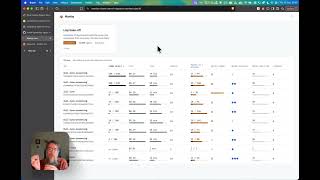
And again, I'm up about 40% after 4
0:02
months, so it's pretty consistent. So,
0:03
for me, getting more than 5% on a trade
0:06
that is on average lasting less than 6
0:09
days, that's something I'm very happy
0:11
with. Just knocked over 100% return last
0:14
year. 1 year ago, Simon Black presented
0:17
his time flies strategy here on Theta
0:21
Since then, it has become one of my
0:24
favorite strategies to trade, and so
0:27
far, I'm very happy with the results.
0:31
But, strategies evolve. What has Simon
0:35
learned during this last year? Welcome
0:38
back, Simon Black. Hey John, how's it
0:40
going? Great to be back. Uh give us this
0:43
short summary of what a time fly
0:45
strategy is and how it has worked for
0:48
Yes, so a time fly spread strategy is um
0:51
it's my go-to strategy. It's a delta
0:53
neutral strategy, and it's a short-term
0:55
strategy. So, the strategy lasts about a
0:57
week. So, being a delta neutral
0:59
strategy, it's a kind of strategy I like
1:00
to trade where I don't want the market
1:03
Uh and the nature of the strategy and
1:05
how it's um put together is such that
1:08
um it handles volatility expansions
1:12
and contractions. So, this looks at the
1:14
contractions pretty well. And
1:17
importantly for me, being in a country
1:19
where I'm asleep for half the market,
1:21
it's the kind of trade where I only have
1:23
to look at it once a day. So, that's the
1:26
trade I like to trade. Tell us, who are
1:28
you? Well, as you said, my name's Simon.
1:30
I am in New Zealand, uh capital city
1:33
Wellington. I have an engineering
1:35
background. I'm an electrical engineer
1:36
by trade, and I'm focusing mainly in
1:38
software engineering these days. I have
1:41
always been interested in numbers and
1:42
finance, and I was naturally drawn to
1:47
and I just find it fascinating. So, now
1:50
it's kind of it's my hobby, and it's
1:52
sort of my my goal, long-term goal, is
1:57
this engineering work and and ramp up my
1:59
trading to be a full-time trader.
2:01
But yeah, and then one of my favorite
2:02
hobbies is playing with new strategies,
2:04
inventing new strategies, seeing what's
2:06
what's possible. Um I just love that
2:08
part of it so much. And this is actually
2:10
the first time I had to do a second
2:12
interview interview on the same
2:14
strategy, but this was a very popular
2:17
video on on the channel and I'm sure you
2:20
have developed it further during this
2:22
year and also, as I mentioned, this has
2:25
become one of my own favorite trading
2:27
strategy strategy I really like doing.
2:31
So, I think it's time for an update. But
2:34
let's start with the basic. What are you
2:38
trying to achieve with your time flies
2:40
strategy? So, I'm trying to build a
2:43
trade, um like I mentioned, that it's
2:45
delta neutral. So, if you've traded
2:47
something traded something like an iron
2:49
condor in the past, um you'll know you
2:53
uh a boundary around sort of a central
2:55
point and you want the market to try and
2:57
sort of stay in the middle. Myself, like
3:01
aren't very good at predicting market
3:03
direction, and so I gave up on that a
3:05
long time ago, and so I'm hoping to for
3:08
the market to not move much. But if the
3:10
market does move, I'm hoping to build a
3:12
trade where the volatility contractions
3:15
and expansions that happen with market
3:18
um are taken into account and
3:20
let the trade withstand that a little
3:22
bit. And let's describe the basic trade.
3:25
Maybe it's easier if we bring up an
3:28
example or build a stra- build a trade
3:30
from the beginning. A time flies spread
3:32
is a combination trade of two trades and
3:37
if you've seen me talk about this before
3:38
on your channel, it's two components,
3:40
one of which is a put diagonal and one
3:42
of which is a call broken wing
3:44
butterfly. So, just for reference, it's
3:46
outside market hours, so the pricing
3:48
might be slightly off. It's um
3:51
just before market open uh here, but
3:54
what I'm going to do is I'll go into
3:58
uh Russell cuz it's my favorite thing to
4:00
trade, the um tight price spread on.
4:03
I'm going to build a put diagonal. So,
4:05
what I'm going to do is I'm going to
4:08
this is a Friday expiration. I'm just
4:09
going to change alter this long date to
4:13
be a bit tighter in. And what I'm going
4:15
to do is go um some percentage below the
4:19
Um so, you can see here this this short
4:22
strike is about a week out, right? So,
4:24
I'll go a little bit below.
4:26
Um I'll I'll just going to go percentage
4:28
in a 2% or so below. Uh let's going to
4:32
somewhere around here, give or take. Um
4:35
and I'm going to drag this. So, a
4:36
diagonal is a is a trade where you sell
4:41
you sell an option and you buy an
4:42
option, but they are different in strike
4:46
and expiration. So, this one is closer
4:48
That's a shorter time and longer time.
4:50
So, I've always start with this. I don't
4:53
Let's say 10 wide as an example. So,
4:56
um here is a diagonal. If I just pull
4:58
the range out a bit here,
5:02
and so, this is what a diagonal looks
5:06
over time, if the market drop down a
5:09
little bit and volatility what will move
5:12
time forward a bit here,
5:14
the idea is that that um slider could
5:19
Um sorry, the time as the slider moves
5:21
forward, it pulls up. Um and so, that's
5:24
sort of what's below the market price.
5:26
And we've mentioned in the past that
5:28
usually when the market starts
5:30
you know, dropping 2 3%, you might get a
5:32
little bit of a volatility increase. So,
5:34
if I drag the vol slider up, you'll see
5:37
it also pulls up. So,
5:40
that's kind of what I put below the
5:42
market. So, let me just reset
5:46
Um what I like to do normally when I put
5:47
these trades on is drag the time side
5:49
all the way to sort of 24 hours to go
5:53
cuz that's sort of we'll talk about that
5:54
later about exit criteria, but that's
5:56
sort of where I want to be out of the
5:59
by the time I get out. So, that's the
6:00
that's the bottom half. And so, what I
6:02
like to do then is put a trade above the
6:08
again have a trade that can handle what
6:10
would happen potentially when the market
6:12
drifting up, which is normally
6:14
volatility might contract a little bit
6:16
when things are good, volatility goes
6:18
down. So, I'll go I mean I'll just pick
6:20
a point yeah, some percentage above the
6:23
market again, maybe a similar amount.
6:25
And this is where you can play and
6:27
decide whether you're bullish or
6:28
bearish, whether you want to
6:30
um, skew it in a certain direction which
6:32
is perfectly possible. So, what I'm
6:33
going to do is do a a broken wing
6:36
this is sort of a normal kind of
6:37
butterfly. What I'm going to do is make
6:38
it a broken wing butterfly by moving
6:40
this further away. And so, what I'm
6:43
>> broken wing butterfly you have unequal
6:45
distance to That is right. So, as an
6:47
example here, let's just make this so
6:49
it's something we can see. This is 15
6:51
and 30 yeah, 29 15 29 35. So, that's 20
6:54
wide. This one here, let's make it a
6:56
little bit I don't know.
6:58
Like say there somewhere. Um, and now
7:02
what we have is this sort of this is
7:04
sort of the basis of the trade. Now,
7:05
this isn't quite exactly how I would
7:07
get it looking. We'll talk about a
7:08
little bit later about getting the curve
7:10
right, but this is the basic structure
7:12
of this trade and that we have a trade
7:14
below and a trade above. So, we will get
7:16
back to a little bit more how you adjust
7:20
the perfect curve so to speak, but
7:22
essentially to sum up so far, you have a
7:25
put diagonal below the market and you
7:27
have a call broken wing butterfly above
7:30
the market. Yes, and just to clarify
7:33
that the expiration of the short of the
7:35
diagonal matches the expiration of all
7:37
the legs on the broken wing butterfly.
7:40
Let me interrupt with a quick tip if you
7:43
like trading earnings. Earnings trades
7:45
are some of the most exciting
7:47
opportunities in the market, but they
7:50
can also be tricky to do right. Big
7:53
moves, changing volatility, it is not
7:56
always obvious what makes sense.
8:00
There is a great tool to help you with
8:04
It gives you data on upcoming earnings
8:07
like expected moves, historical
8:09
reactions, and volatility patterns.
8:13
And you get tips about the best earnings
8:15
trades to consider right now. So, if you
8:17
like earnings trades, this tool will
8:19
give you the data you need to find and
8:22
evaluate great trades.
8:24
I have a negotiated a special discount
8:27
for the Setup Profits community. 33% off
8:31
the annual plan or 50% off your first
8:35
You find the discount link below or in
8:39
All right. Back to the interview.
8:43
All right. So, let's get a bit more into
8:45
your entry mechanics. Let's start with
8:47
underlying. You mentioned that you your
8:50
favorite underlying is root. Why is that
8:53
and what other underlying could this
8:55
work on? Yes, I initially started
8:58
trading this on SPX and SPX was
9:01
fine and I was doing great and then
9:04
tastytrade changed the margin
9:07
such that I couldn't cuz I was trading a
9:09
single contract in a separate account
9:11
for the purposes of record keeping and I
9:14
change what I was doing. So, I thought
9:15
what if I just what would happen if I
9:17
just moved to the Russell instead, you
9:18
know, Russell and SPX. Obviously, SPX is
9:20
the top 500 companies. Russell 2000 is
9:24
best quote unquote best 2000 small cap
9:26
companies. I thought how different could
9:27
it be? But the moment I started trading
9:29
Russell, I found I could get
9:32
a better looking curve and a wider
9:34
range. Now, the wider range you think
9:37
okay, that's great, but Russell does
9:39
move more than SPX. Like, when the
9:42
when SPX drops 2%, Russell might drop
9:45
3%, whatever. But, I just found that I
9:47
was getting good results with Russell.
9:49
And so, in the end, I was like, well,
9:51
this is fine. Why bother going back? To
9:54
be clear, it's still perfectly valid to
9:55
trade it in SPX, and you can definitely
9:57
get trades winning trades, as you you
9:59
know. But, I just like Russell. But, in
10:02
terms of any other underlying as we just
10:05
I just mentioned that this trade is all
10:08
a diagonal below which benefits from a
10:10
volatility increase and a broken
10:12
butterfly above that benefits from a
10:14
volatility decrease. So,
10:16
any instrument's fine where that
10:20
relationship is true. And so, things,
10:22
for example, like trading gold like,
10:25
sometimes when the market's crashing and
10:28
and volatility's going up in general
10:29
across the market, the price of gold
10:32
might go up. It's almost
10:33
counterintuitive. And things like the
10:35
bonds, if you trade anything about the
10:37
bonds, volatility can increase in both
10:39
directions. So, it has to be a an
10:43
what we think of as a normal thing where
10:44
ah, it's crashing and burning, vol's
10:46
spiking, or everything's happy, it's
10:47
going up. So, any of the indexes are
10:49
great. I personally like indexes because
10:52
they're cash settled, no no assignment
10:55
I've traded these in um
11:02
ETF. I've traded them in options on
11:08
uh / ES and the Russell one as well. So,
11:11
there's a wide variety of instruments
11:13
you can use. What are the days to
11:15
expiration you are using? I've had a lot
11:18
of people who trade this try short-term
11:21
trades, and I also tried
11:22
you know, when I was experimenting
11:23
building this short-term trades. My
11:27
tip is it has to be a minimum of 7 days
11:30
to expiration from when you put it on to
11:33
expiry. You can go longer. When I first
11:36
started this, I was sometimes I was
11:39
the those shorts were 14 days to
11:40
expiration. I thought maybe further out
11:43
you can get a wider range. Is this
11:45
better? And in the end it I sort of
11:51
of sort of 7 to 14 days gave very
11:54
similar results. So,
11:56
now I personally like to trade
11:57
[clears throat] on um
12:00
Thursday market time.
12:02
Um for me that's Friday morning. It just
12:03
suits my lifestyle better. There's
12:04
nothing magical about a Thursday. It's
12:06
just what I like to do. So, when I'm
12:08
putting the trade on for the new
12:10
expiring the following Friday. So, for
12:11
me it happens to be 8 days to
12:14
Could be 9 days, 10 days, whatever. And
12:17
then the long is the week after that. Uh
12:20
and you can you can play with that and
12:22
get different curves. But that's sort of
12:24
a I'd say don't try to trade this trade
12:26
less than 7 days. Let's get back to
12:29
options trade. And so, uh what happens
12:32
with this trade when the volatility go
12:34
up and down as you have mentioned a bit.
12:38
Right. So, here is um
12:40
a trade just sitting here. And so, at
12:43
the moment the volatility slider is um
12:46
sort of where the market is at. Um of
12:48
course, if the market started falling
12:52
dramatically for whatever reason,
12:54
there's some big news or whatever, quite
12:56
often volatility spikes. So, if I start
12:59
dragging the vol slider up, what you see
13:01
is the overall quick curve both to the
13:04
upside and to the downside, but
13:05
especially the downside, um starts to
13:08
rise. And the break even at the bottom,
13:10
it wasn't screen before, now it's gone
13:12
completely out of screen. So, what would
13:15
whatever 3.5% or whatever break even to
13:18
the downside, a vol spike has made that
13:20
much bigger. So, there's a little bit of
13:22
natural buffering built into the
13:25
And just resetting that,
13:27
volatility never really crashes down
13:29
like it spikes up and then just drifts
13:32
But when news is when things are good, I
13:36
mean, I guess if say the Iran war ended
13:38
tomorrow, maybe vol would really drop,
13:39
but in general vol just gradually goes
13:41
down. So, if the market was just
13:43
gradually moving up and vol was just
13:46
gradually moving down, so imagine this
13:48
price line is moving up and you know,
13:50
sort of slowly moving up. If we start
13:53
dragging the vol slider down, the line
13:55
where the market is now is going to pull
13:57
[clears throat] down. But the
14:00
the curve under the tent starts pulling
14:04
if things work nicely, the market drifts
14:08
and then you end up in a curve end up
14:10
under the tent where
14:13
where the vol decreases sort of giving
14:15
it some help, if that makes sense. I'm
14:18
curious now how you choose your strikes
14:21
and how you kind of define what is the
14:23
best trade to make this week. If you've
14:27
an iron condor before or something like
14:29
that, you'll know that when volatility
14:33
options are more expensive. And so, the
14:36
options you're selling, you you you get
14:38
more for them, of course. So,
14:40
when volatility is high, you can make
14:47
it's just a a wider range. Volatility
14:49
literally means the market is volatile,
14:51
the market could move more. So, my
14:53
strike selection is pretty much and
14:56
there's no magic formula for this, but
14:58
when VIX is quite low, my strikes are
15:00
closer in. You know, maybe I think when
15:04
I put a trade on, I've got a trade I can
15:06
show later, one I'm actually in. I put
15:09
Um VIX is about 17 at the moment, which
15:11
is it's not high, definitely, but it's
15:14
not super low. It's sort of
15:16
on the lower side of low. I think I
15:18
decided to go about 2.2, 2.3%. That's
15:21
just an arbitrary number in my head uh
15:24
either side if the VIX was higher in the
15:26
20, 25, I could go much further out of
15:29
maybe 3% above and below. And so,
15:32
what you do find is that
15:34
with getting trying to get the curve
15:36
right is that it it's sort of
15:38
it's sort of self-correcting. If you try
15:42
like you try to give it too big a range,
15:44
you get a big sag in the curve in the
15:46
middle. It will make more sense when we
15:48
we really focus on the on the curve
15:49
later. But, um yeah, so I think
15:53
the volatility kind of helps you
15:54
naturally pick it, and the curve helps
15:56
you pick it. If you get it wrong, it you
15:59
you can't get a good curve. So, I think
16:00
the first thing you can try is let's
16:03
short strikes. It's all about the short
16:04
strike. You get the short strikes kind
16:06
of in the right place,
16:07
the rest are kind of easy. So,
16:09
if you think about it about the short
16:10
strikes a little bit like I'm putting on
16:13
where is the market going to going to
16:15
be? It's a good way to think about it.
16:17
You have mentioned the curve if you
16:19
times, and I know that you are very
16:22
concerned that you want to create the
16:24
perfect curve when you open a new trade.
16:27
So, please explain for us how you choose
16:30
your strikes, and what is a perfect
16:33
curve for this trade?
16:37
the the perfect curve for me is one that
16:45
curve, and it sounds so simple. The
16:47
trade on the screen at the moment is an
16:48
actual trade I'm in. I entered it uh
16:51
today. Um if you come back to my website
16:54
later and look at the trading results,
16:55
some point you'll better see how this
16:56
trade worked out. But, what you can see
16:58
with this trade, it's exactly the same
17:00
structure you saw before. There's a put
17:02
broken wing butterfly below, and a call
17:04
broken wing butterfly above. But, what I
17:05
want to do is I'll pull the time slider
17:09
forward. And unlike the last demo where
17:13
looked a bit janky, to be fair, it was
17:14
kind of sagging in the middle. As this
17:16
one pulls up, and just to be to be
17:20
transparent, the market has dropped
17:21
about a percent overnight since I put
17:23
this on outside of hours. But notice
17:25
this curve as I move forward, it's nice
17:27
and round. Like it's it's kind of
17:30
even either side. It's going up and up
17:33
and up. This is the kind of thing I'm
17:35
looking for. I don't want
17:37
And as I get closer to like a day to
17:39
expiration, say 24 hours, it's starting
17:41
to bend a little bit here, just sort of
17:43
here. It's bending here. But almost all
17:46
the way up. It was almost I think I'll
17:48
go back just a little bit where I was.
17:49
Is it so that the further out shorts are
17:53
the the sooner you will get this sagging
17:57
Yeah, I think if you if you move the
18:00
broken wing butterfly too far away, it
18:02
it will sag. And one way to see that
18:05
actually, if I bring the time slider to
18:07
the extreme expiry, right? The reason
18:09
why is this is this this big low point
18:11
here, right? This is clearly the
18:14
This is going to pull it down.
18:15
Right? But leading up to that, if I move
18:18
back a little bit again,
18:20
see how this is kind of nice and round?
18:23
So this is what we're aiming for because
18:25
it gives it a nice range, right? So you
18:28
can sort of see here this trade expires
18:30
on you can see there May 22nd
18:34
with a day and a half to go according to
18:36
the Option Strat. Again, this is all
18:37
theoretical pricing, you know, you can't
18:40
trust exactly Option Strat, but it's a
18:41
guess. But this is sort of showing this
18:43
trade could handle a 3.6%
18:46
jump to the upside and a
18:49
What is it to the downside?
18:51
About 3.8. So it's a a pretty balanced
18:53
trade. So you'll see here this dotted
18:54
line is sort of right in the middle.
18:57
This is a classic delta neutral trade.
18:59
The fact that the curve is the highest
19:01
where the price currently is
19:03
is it shows you how delta neutral this
19:06
is. If if the if the peak of the curve
19:09
either side of where the price is,
19:11
you've either skewed it to the downside
19:13
or the upside, and that's a perfectly
19:16
thing. The thing about this trade is
19:17
nothing stops you making this trade
19:21
higher or lower if you have a feeling
19:23
that the market's going up or down.
19:25
I never get those feelings cuz I don't
19:27
know what's going on, so I just try to
19:29
center it and hope that the market can
19:31
last. And so, you want a nice smooth
19:36
You also have those tops of the profit
19:38
attends on the input diagonal on the
19:43
does that matter how high they are in
19:46
relationship to each other? It it kind
19:51
I mean, I think so. I like to think of
19:53
use the analogy before. I like to think
19:56
imagine that green line is a rope
19:59
and those points are pulling that rope
20:04
what you find is this diagonal here,
20:06
this is higher up. It's almost got more
20:08
force. It's going to pull that bit up
20:09
higher. And so, if you find, for
20:11
example, your curve is sagging quite a
20:14
say to the upside, you want to make sure
20:17
this this point is up higher. And how do
20:20
you make the point higher
20:22
in a broken wing butterfly? It's quite
20:24
simple. You just make it wider. So, if I
20:26
wanted, just as an example, I'm just
20:28
going to make this wider.
20:31
All right. Now, this is outside market
20:33
hours. It's sort of weird. I'm going to
20:35
try to get it like that. Now, now these
20:37
points this point's higher, right? So,
20:40
it's just, you know,
20:42
you can play with all these sliders to
20:43
to see what you you want to do, but
20:48
if you can think about both of these
20:50
trades are trying to pull the curve in a
20:52
different direction, then if it's
20:54
pulling one way or the other, you can
20:56
adjust one way or the other to try to do
21:01
it's almost counterintuitive if you're
21:03
not used to trading these trades. Making
21:08
we'll pull the butterfly peak higher,
21:10
but making a diagonals widths
21:13
uh closer actually pulls up the diagonal
21:15
point. So, something to play with an
21:17
option strat. It's It's quite easy just
21:19
to slide the sliders and and see what
21:21
happens, move prices around. So, So,
21:23
this is basically an artistic approach
21:25
to opening a trade where you kind of
21:27
play back and forth and until you find
21:30
what I've been asked by so many people,
21:31
can I automate this trade? Could Could I
21:33
make a, you know, a formula like enter
21:36
sell the 20 delta, whatever, buy the 30
21:38
delta, whatever it is. And it's like,
21:40
well, I've never considered it because
21:42
every week volatility is different, the
21:44
market conditions are different every
21:47
And people who who follow my trades will
21:49
will see that the the the the the
21:52
diagonals are actually pretty
21:54
but the broken wing butterfly widths are
21:56
different almost every week
21:58
depending on what's happening in the
21:59
market just just to get the curve right.
22:02
So, I quite like this approach. I want
22:03
the trade to look look good. It's It
22:06
seems so simple, but um
22:09
yeah, that's how I do it. So, Simon, you
22:11
have the beautiful curve you can admire
22:14
and you are free to open the trade, but
22:19
When do you take it off? What are your
22:21
rules? So, I like to use buying power as
22:25
my metric. So, if a trade has a buying
22:29
power, and for these trades the buying
22:30
power and the max loss are very similar.
22:34
Um so, in option strat you can actually
22:36
can show you in this trade I'm in. If I
22:37
slide the range slider to the extreme,
22:40
you know, how much could I lose in this
22:42
trade? You know, you're getting down
22:44
here. I mean, you can go all the way to
22:45
the bottom, but let's say the market
22:47
dropped, I don't know, 10%, which is
22:49
probably unlikely, but let's say it
22:51
about $1,300 or whatever. So, let's say
22:54
the max loss or Well, it's not the max
22:56
loss, but let's say the buying power is
22:57
about that. So, I would say buying power
23:01
$1,300. I would be [snorts] keen for 10%
23:04
profit. So, if this trade shows
23:07
10% of a $1,300, which is $130,
23:11
I would get out. I'm happy
23:13
um with that 10%. If
23:16
you know, the trade is going through the
23:18
still price is still right in the center
23:20
of the curve, you can try and, you know,
23:23
hit more of a home run and get a higher
23:25
return. I've had over 20% returns
23:28
in the past number of times. I've had as
23:30
high as 40%, but that was usually due to
23:32
a big volatility spike. But, um
23:35
it somewhere between 10 and 20% is
23:37
definitely where I'd like to get out.
23:38
I've been in situations before where
23:40
it's been hovering just below 10%
23:42
getting near the market close for the
23:45
it's it's the almost the most
23:47
interesting time. It's like, should I
23:48
just take 8% and run? Or should I wait
23:51
and see? And sometimes you wake up the
23:54
next day and it's back down to 3% or you
23:57
wake up and it's 15%. So, it's a bit of
24:01
you asked me how this trade has changed
24:03
over time and I think one thing I've
24:05
done more of and this year especially is
24:08
if it's close enough for a profit, I
24:11
will take the money and run. And to be
24:12
in some part to be fair, it's
24:14
the market at the moment is crazy with
24:15
this Iran conflict, oil dramas. And so,
24:19
you know, the market who knows what's
24:20
going to happen. So, at the moment I'm
24:21
being being quite conservative. I think
24:25
sort of quote-unquote normal market, you
24:27
might be able to hold these trades a bit
24:28
longer if the market's not moving much.
24:30
So, that's what I like to do
24:32
in terms of getting out. And I think
24:33
that's also my experience from trading
24:36
this that you it's very smart to take
24:38
the profit when you have it because it
24:41
it can change quite quickly, especially
24:45
>> get nearer to the nearer to the
24:48
expiration. And what looks like a very
24:50
positive trade one day can have changed
24:53
in fact, my biggest loss in it in April
24:57
where I had two contracts on and they
24:59
reached 10% and I was
25:02
took only one off and the other I left
25:04
for the next day hoping for more and
25:06
that ended up as one of my biggest
25:09
losers. So, take your profit I think is
25:11
a good advice here. It's it's always
25:13
good advice and one thing I always say
25:16
to to people who are in my discord and
25:18
and follow my trades is there's actually
25:20
nothing wrong with taking a loss.
25:22
Sometimes you'll wake up and markets
25:23
dropped a couple of percent and it might
25:25
be showing a small loss.
25:27
And people are like, "Oh, what should I
25:28
do? Should I adjust?
25:30
Should I just hope? Should I get out?"
25:32
And to me, taking a 1 or 2% loss is
25:36
you know, who cares?" Like that's
25:38
that's the least of your worries taking
25:41
I I want to get out for 10%. I will
25:44
definitely get out if if the if the
25:45
whole trade is down 30 40% like a big
25:49
big move, something has gone crazy.
25:51
I'll just get out. There's There's no
25:53
point trying to risk your trade which is
25:55
beyond hope price. Sometimes, you know,
26:00
try to they try to save every trade. I'm
26:03
in a delta neutral trade. I don't want
26:04
the market to move. If the market moves
26:08
this is not the trade for me. I was
26:09
wrong. You know, I I can't you can't
26:12
sort of you can't have it both ways.
26:13
Either you're trying to be delta neutral
26:15
or you're trying to pick a direction. If
26:16
I'm in a delta neutral trade and the
26:18
market absolutely just
26:20
bombs or for some reason flies up, I'm
26:22
happy to take a loss. I think taking a
26:24
loss is just part of trading. I'm not
26:26
afraid of that at all.
26:27
I know you also have a deadline for when
26:30
have want to be out of the trade no
26:34
Yep, it's and to me it's very important
26:36
rule and if you if you bring up options
26:39
spread again, I can can show you why
26:40
that is. This trade here this is options
26:43
spread again like I mentioned, it's just
26:44
theoretical and it it's just a guess of
26:47
what's going to happen, but this trade
26:49
here is showing what things could look
26:52
1.7 days to go. You know, so you're on
26:56
you're on Wednesday morning. It's like,
26:58
"Yeah, we're going to
26:59
go to war whatever it is
27:01
Thursday morning, sorry." You got to the
27:03
end of Friday. But, if you
27:05
if your price was somewhere up around
27:08
this is great. I'm going to you're going
27:09
to make you're going to make lots of
27:10
money. As you slide this forward, so I
27:15
24 hours to go. I like to quote be out
27:17
by the Thursday. I don't want to hold it
27:18
on the Friday. So, on the third on the
27:21
end of trading on Thursday, you're sort
27:22
of sitting somewhere around here, 24
27:24
hours to go. Still looks pretty good,
27:26
but the moment you start getting to that
27:28
last day, that curve really starts to
27:31
whip around. Now, if you're over here,
27:34
if you're up on the diagonal, fantastic.
27:36
But, if you're But, because the market
27:38
can move a percentage a day easily, next
27:41
minute you're here and you've gone
27:43
you've your loss has been given away.
27:45
And what's worse is if not only if you
27:47
were here and the market flies up and
27:48
the volatility drops,
27:52
your curve can pull along by the line.
27:54
So, what was going to be a nice
27:57
profit or at least a profit the day
27:59
before, you hold into the last day with
28:01
a volatility drop, and next minute it's
28:04
it's a small loss, right? So,
28:07
that's why taking the money when it's
28:08
there is quite important because
28:10
holding to that especially holding into
28:11
the last day is a bit fraught.
28:13
Personally, I often let the trade be
28:16
open in options start after I have
28:18
closed it. So, I see where it would have
28:20
developed. And of course, there are some
28:23
weeks where it would have been fantastic
28:25
profitable in the middle of those 10
28:27
$2,000 or whatever, but there are just
28:29
as often weeks when it would have ended
28:32
up with minus 1,500 minus 2,000. So,
28:35
that last day is really volatile. Stay
28:39
out of it. Yeah, exactly. Yeah, what
28:41
they say is hindsight's 20/20. So, yeah,
28:46
I learned a long time ago not to try to
28:47
hold it until the last day.
28:49
And you know, like you can look at it
28:52
and go, "Oh, if I just held for
28:53
tomorrow, what what is actually showing
28:55
as a loss might be a profit." So, I will
28:58
at the last bit of middle on Thursday
29:00
for a loss. I don't want to even try to
29:02
do it on you know, Thursday so on
29:05
But Simon, this trade doesn't always
29:07
work out, right? So, what are the most
29:09
typical situation when things go wrong
29:12
and you need to decide what to do? Um
29:15
well, like I mentioned, it's a delta
29:16
neutral trade, right? So, the the
29:18
the main thing well, pretty much the
29:19
only thing that can go wrong well, not
29:21
the only thing, but the main thing that
29:22
can go wrong, of course, is a big market
29:24
move, either up or down, right? Because
29:26
we're trying to be in the middle of that
29:27
curve. If we move down a lot,
29:30
you know, or up a lot, we start to get
29:32
beyond what the break evens could be.
29:34
The other thing, which is not doesn't
29:36
happen as common well, it's not as
29:37
often, I should say, is that there's
29:39
some big vol crash. For some reason,
29:41
volatility is artificially high. Maybe
29:43
there's been some big news, and then
29:46
uh dumps. And we we have seen it this
29:51
volatility's up because of the oil
29:52
crisis in Iran, and then next minute,
29:54
there's a ceasefire and the vol drops,
29:56
and then there's not a ceasefire and it
29:59
the biggest things are big market moves
30:02
or a vol crash. Um in those situation,
30:05
obviously, one choice is to close the
30:08
trade. But if you want to save it or
30:11
manage it, could we look at a couple
30:13
situations that could happen and what uh
30:15
what you could consider doing in those
30:18
situations? Again, this is a real trade
30:20
I'm in. I like to keep the slider around
30:23
this whole about a day to go cuz it sort
30:25
of shows me where the trade is going.
30:26
So, if you imagine we're in this trade
30:29
right now, obviously, it looks great at
30:31
the moment where we're going to end up.
30:32
But let's say we woke up tomorrow and
30:34
the market had dumped down
30:36
some percentage, and we you know, we we
30:39
get down here somewhere. If we were down
30:40
here, there's only a half a percent gap,
30:43
right, to break even. We're at the point
30:46
if the market dropped, you know, say it
30:49
dropped down 2 and 1/2% overnight, and
30:51
then it dropped down another 2% the next
30:52
day, we would be in this territory here.
30:55
Now, like I said, I keep banging on, I
30:57
say it often and often all over again,
30:59
taking the losses fine, but if you like
31:01
you said, if you decide I really want to
31:03
try and rescue this trade or make it
31:05
last or whatever, maybe it's early in
31:07
the trade and you think it's going to
31:08
bounce back, whatever reason.
31:10
The downside adjustment, my go-to and is
31:12
this is where you use your sort of um
31:14
your sort of trader's toolkit. You've
31:16
You've got a few skills and you know
31:17
some trades. I like uh calendars for my
31:21
downside adjustment. Calendars are
31:22
really simple. I I use I keep it really
31:25
simple. It's the same dates as um
31:28
as the diagonal. So, let's say the
31:29
market's coming down, I might decide to
31:33
you know, put a diagonal on. So, I'm
31:35
just going to throw one on and then I'll
31:36
throw a calendar on and then I'm just
31:37
going to have a play. So, I'm just going
31:39
to sell put and buy a put.
31:43
And I'm going to change the expiration
31:45
to match the other one.
31:48
And instantly you get this big
31:51
curve, right? And so, this is giving you
31:54
big you know, move to the downside.
31:57
Yeah, and so, you know, you've got even
31:59
a bigger break even. And of course, if
32:01
the market did keep dropping down,
32:02
volatility might keep spiking up and
32:04
that gives you even more room. So,
32:06
to be honest, I'm not afraid of of
32:10
downside moves. Obviously, I'm afraid of
32:11
a 10% crash, of course, no one can
32:13
survive that, but for that sort of
32:16
3% shock, I might better recover. But,
32:19
this looks great on paper, but the the
32:21
issue with this is this trade, I don't
32:23
know if you noticed earlier, this trade
32:25
I think it was two nearly $270,
32:28
something. The point is now the whole
32:29
trade costs more, and I don't actually
32:31
care about the cost in general, but
32:33
because the trade costs more,
32:35
if the market then recovered, right?
32:38
You and let's say it bounced back up.
32:41
You could be like, well, this I don't
32:42
need this calendar anymore. I can sell
32:43
it. So, you'd sell that calendar at a
32:45
loss, which is fine.
32:47
But basically now, what that would mean
32:49
is this this lower point here
32:52
will be quite low now. You've spent more
32:54
money, right? So, where this curve was
32:56
higher up, now it's lower down. So, that
33:00
that's the disadvantage of these
33:01
downside adjustments is if if you
33:04
turns out you didn't need it and the
33:07
the chance of getting the profit now is
33:08
low. And if we talk about my trading
33:10
results later, if I I can show you some
33:12
examples, you'll actually see that
33:14
almost all my adjustments don't lead to
33:17
some big win. They just lead to a
33:20
minimized loss or maybe a small profit.
33:23
So, for me, when I'm adjusting, I'm
33:26
it's defense mode. I'm not I'm like,
33:28
okay, I'm in a delta neutral trade.
33:30
It's not going my way. What can I do to
33:32
try and get out of this with the least
33:34
damage? So, that's where I think of
33:35
adjustments there. You're better to try
33:39
that trade if if possible.
33:42
You said that you are not so afraid for
33:45
the downwards moves,
33:47
I guess because you get some extra help
33:49
by the increased volatility that
33:52
typically follows that move. But when
33:55
[laughter] the market jumps up, like we
33:57
had in April, we had like
34:00
market recovery that was pretty
34:02
marvelous and it moved very very quickly
34:06
to the to the upside. How do What do you
34:12
what I've been doing recently, this is
34:14
not even an adjustment, but when you
34:17
set up this trade and play with the
34:19
widths and stuff, I'm just going to move
34:20
this range about higher.
34:22
Again, I don't know if you can s- I
34:25
mean, you should be able to see this,
34:26
but you'll see here the loss to the
34:27
downside, we talked about that before,
34:29
1,300 or 1,400. Notice that the upside
34:32
is actually deliberately not as much.
34:35
So, I've skewed this trade to have less
34:38
to the upside. And you can actually skew
34:40
it to have less risk to the downside.
34:42
So, you can you can actually play with
34:43
it at the market at the moment. I'm a
34:45
bit afraid of a big upside move. So,
34:48
I've made it that even if there was some
34:51
the damage will be less. But back to
34:53
your question about actual adjustments.
34:56
it's almost counterintuitive, but quite
34:57
often what happens is
34:59
when the market starts falling up,
35:02
um volatility has probably naturally
35:05
dropped down a bit. Things have kind of
35:07
back to normal. And one simple thing I
35:10
do, and it is counterintuitive, I like
35:15
you know, a call calendar or a sort of a
35:18
diagonal above the market. It gives it a
35:20
bit of a target to hit, and I know that
35:22
a volatility contraction doesn't play
35:25
well with call calendars.
35:27
But my reasoning is that volatility is
35:29
already dropped quite a lot. That's why
35:30
we're already on the way up. And so, is
35:32
it going to keep dropping more? I don't
35:34
know. So, just give an example. To be
35:36
fair, I I I'm more prone to like just
35:38
take a small loss for a big upside move,
35:40
but if I wanted to try and rescue it,
35:42
I'm just going to throw a random um
35:43
calendar on here. I'm not even going to
35:46
uh exactly where I'm putting it, but
35:48
just to sort of show you what this can
35:50
It's going to change the expiration.
35:54
So, it gives a bit of a bump here,
35:56
right? And so, again, it's got a bit
35:58
more room. But what you can do is you
36:00
can start playing with this and move it
36:03
along a bit. And if you actually
36:05
um people Some people aren't really
36:07
familiar with the diagonal. We are the
36:08
long that's closer, but if you move the
36:10
long a little bit closer to the market,
36:12
it even goes even further.
36:14
All right? So, you sort of get to this
36:16
point where it's going further. Now,
36:19
like I said about volatility, the
36:20
downside of this is if there really is
36:22
if there was a lot of juice in the
36:23
market and if there's still a a of
36:25
volatility to come out, if I start
36:27
pulling this down, you'll watch that
36:28
break even come closer and closer and
36:29
closer and closer and closer.
36:31
Right? So, you're trying to protect, you
36:34
know, and it's it's still only, you
36:36
know, maybe it's fine, maybe it's not,
36:38
but I if you want to try and adjust to
36:41
the upside, I just try to give it a
36:43
little target because calendars make the
36:47
you pin it right. If you if the you end
36:48
up close near expiration on that, you
36:52
that that that price. Um of course, like
36:54
I said, I don't hold to expiration, but
36:56
the curve sort of pulls up. But then
36:58
again, there's that downside is that uh
37:00
going back now I've spent more money,
37:04
if vol did drop and then it it it would
37:07
sort of maybe there's a big vol crush
37:09
and that's sort of now this is the
37:10
normal vol amount, right? And then the
37:12
market starts coming down again.
37:14
Maybe we pull and we get further and
37:16
closer I don't know. We we we get Yeah,
37:18
you can sort of see the moment you see
37:21
zero, there's always a chance of taking
37:24
if I if I keep dumping vol down,
37:28
you know, this is more negative now. And
37:29
the reason why this is more negative is
37:31
I've spent more on the trade
37:33
because I paid for a calendar. So, with
37:35
every adjustment, there's the trade-off.
37:37
It's 100% possible to do adjustments,
37:41
I wouldn't say it's a a beginner sort of
37:43
trade. Luckily, I'm using mainly
37:46
calendars and diagonals to adjust and I
37:49
because that's the basis of the trade
37:51
and I understand that really well, I'm
37:52
pretty comfortable, but Does it matter
37:54
when you make the adjustments? Yeah,
37:57
yes, that's a good point, actually. So,
37:59
if I like I mentioned, I like to get
38:01
into all my trades sort of I get in 1
38:03
week for the next week's expiry.
38:06
If there's something happens on the day
38:08
after I get into the trade, I get on on
38:10
a Thursday, there's something on a
38:11
Friday or on the Monday,
38:13
I might consider adjusting.
38:15
Getting closer to the end of you know,
38:18
the expiration week, you get to the
38:20
point where your adjustments aren't
38:21
going to do anything for you, you know,
38:26
you're trying to counter that that early
38:28
move in the trade. If If you get some
38:32
it's almost like the ship has sailed at
38:33
that point, so it's easier probably just
38:34
to take a small loss.
38:36
Adjustments are possible later, but
38:39
that's that's getting into sort of
38:40
almost expert territory. And to be
38:43
honest, I'd rather just be like, "Look,
38:47
than to try and adjust it and turn it
38:49
into a 20 20% loss or whatever." So,
38:53
Approximately how many of your trades
38:55
have you ended up adjusting?
38:58
I actually was looking at that earlier.
39:01
I can show you my results page if you
39:03
want to I can count them exactly, but
39:07
I think last year it was about 20%, but
39:10
this year it's closer to 15%, so it's
39:13
not a lot. Uh Simon, what has been the
39:16
worst loss you had? Really early when I
39:19
started, I this is like 2024, I had a a
39:22
40% loss and it was actually when Trump
39:25
got reelected, the markets went crazy.
39:27
Uh ever since then, I um
39:31
the probably the biggest trade I loss
39:33
I've had on average, I've had a couple
39:34
of 20% losses. So, that's 20% on buying
39:36
power. As you know, I'm aiming for that
39:38
10%, so at the moment a loss might wipe
39:42
out two weeks of gains. Uh what what is
39:45
the worst that can happen with this
39:47
strategy? The worst that can happen is
39:53
crash, obviously, like any anything. And
39:55
of course, I'm trying to be delta
39:56
neutral, so some big crash could result
39:59
um full loss. But the best thing about
40:02
these trades is they are defined risk.
40:04
The moment you enter this trade, you
40:06
know the most you can lose, so
40:09
you can take that into account. That's
40:10
just standard trading risk management,
40:12
you know, don't overtrade, don't trade
40:14
more contracts than you should if you
40:17
you know, like that that trade I was
40:18
showing you was a single contract trade.
40:20
I can lose it that I lost it $1,300.
40:23
Fine. If that's a If that's a black swan
40:26
event, 10% crash, and all I lose is
40:29
that's okay. So, that's why I'm sort of
40:32
I think it's quite a good trade because
40:35
yes, you will take losses, but a lot of
40:37
people get worried about that big crash.
40:40
Um and you will just lose
40:42
you know, these are weekly trades. So,
40:44
if a crash is you'll lose that trade.
40:46
And then maybe vol's gone crazy and
40:48
you'll put a trade on and it
40:50
wins, I don't know. So, yeah. I always
40:52
ask my guests to put their strategy on
40:55
the risk profile scale from one being
40:57
very low risk and 10 being very high
40:59
risk. And where would you put it this
41:01
year and has it changed from what what
41:05
Yeah, to be honest, I can't remember
41:07
what I said last year. I probably said
41:08
about a four or five. I think it's
41:10
probably still there. I mean,
41:14
it's the fine risk, right? So, in terms
41:16
of risk levels, I'm not selling naked
41:19
strangles or anything like that. So, I'm
41:21
not going to wake up $40,000 underwater
41:24
if there's a big vol spike. Um so, that
41:26
makes it low risk. It but I think the
41:28
risk might come from just general
41:30
management of it or even getting into it
41:33
because, you know, diagonals and broken
41:35
wing butterflies, they're not beginner
41:36
strategies. So, I would say it's
41:40
around a four or five for risk just
41:42
because if you don't really know what
41:44
you're doing, it could be more risky. If
41:46
you're an expert trader or
41:47
intermediate trader who's really
41:48
familiar with the diagonals and
41:50
butterflies, then it's pretty low risk.
41:52
One of the reasons I wanted to invite
41:54
you back is that you have traded this
41:56
strategy now for three years. You
41:59
publish your results every single week.
42:03
So, you have a pretty, you know, solid
42:06
results to show. So, let's get into your
42:09
actual results of trading this strategy
42:12
through three years. Yeah, my results
42:15
been pretty good. I'll show you my 2026
42:17
results. They're on my website. Like you
42:20
mentioned, I trade every week, rain or
42:22
shine. I don't skip a week unless I'm
42:24
I'm out of out of the country or on
42:25
holiday. So, I've had 19 trades this
42:28
year so far, 16 winners. So, that's the
42:30
percentage. These are
42:32
These results I'm showing are per
42:34
contract. I personally trade more than
42:36
one contract, but for the sake of
42:37
transparency, I I show my results as one
42:40
contract. That way you can
42:42
factor in how you trade. So, clearly you
42:45
and ironically, John, I think when you
42:47
interviewed me a year ago, you said I
42:48
was up 40% after 4 months. And again,
42:51
I'm up about 40% after 4 months. So,
42:53
it's pretty consistent. And this this
42:54
return annualized is just me sort of
42:56
calculating it. But you also last year I
42:58
ended up I just snuck over 100% return
43:01
last year. I actually
43:03
I actually took a trade, I think, on um
43:05
actually on Christmas It was Christmas
43:07
Day my time. Just I took a holiday trade
43:10
to try and get it over 100%. If it lost,
43:12
it would have got further, but I I
43:13
actually I actually added a note to my
43:15
trade at the bottom here. I actually
43:17
exited on deliberately for $11.60
43:20
profit. I literally took a holiday trade
43:23
just to get it. The moment I got I
43:24
actually I got my calculator out, worked
43:26
out commissions and fees, and worked it
43:28
out if I hit this, get out, it would be
43:32
that's why it's exactly 100% Well, not
43:37
So, that's the full full year result.
43:39
But yeah, so it's it's you know, it's
43:41
100% 200% a year is obviously So, it's
43:43
been consistently profitable for all
43:45
those three years. And if you move back
43:49
I know that you are analyzing what the
43:52
results would be. Yeah, I mean, this is
43:54
just a You can sort of see up here the
43:56
calculation because it's it's 45.4% in
44:00
134 days, and that works out to be like
44:02
if you times it out, you know, this is
44:04
my math geek engineering thing going on
44:06
here. So, this is where if things stay
44:08
the how they are, this is where you
44:10
could end up, of course.
44:11
But that's Simon, and that because
44:13
I have had many interview guests here,
44:15
and one one thing I've found is that
44:17
people measure their results in very
44:19
different ways. But the most common is
44:21
probably to measure by the as a
44:23
percentage of the buying power or the
44:27
used. But you actually do it a bit
44:29
different and I would say conservative
44:32
or generous way because what you do is
44:35
you have allocated a
44:37
set of money for your trades, but you
44:39
use less than half of that buying power.
44:41
So, so so your results is
44:46
as a percentage of the allocated
44:47
capital. So, if you had measured your
44:49
result in the same way as most of my
44:52
it would have looked much much better.
44:55
>> Probably twice or 300%. Yeah. Well, what
45:00
gleaned by talking to me now, I'm pretty
45:02
conservative, and my idea is this. Like
45:05
you've seen me put on these trades, max
45:07
loss per contract of $1,000, say. So,
45:10
let's say I take a max loss, right?
45:12
Well, if if that's my whole trading
45:16
that's no good. So, my idea is I
45:18
allocate $3,000 per contract, right? So,
45:23
you know, I don't know, $12,000 to throw
45:25
at this strategy, I might trade four
45:27
contracts. I could take a full loss.
45:32
I guess in that situation it would be
45:36
take take away 12, you know, 8,000. But
45:38
then I could still probably trade nearly
45:40
two or three. The point is I didn't want
45:42
a lot of full loss on this trade to wipe
45:45
this percentage is based on 3,000. I
45:48
don't risk $3,000 per trade. I cannot
45:50
lose $3,000 per trade per contract. It's
45:52
it's impossible by how I place them. So,
45:56
as as ironic as it sounds, this 100%
45:58
return is the conservative result. It's
46:01
I feel really bad cuz people see these
46:02
results and they're like, "This is This
46:03
can't be real." It's like
46:05
I can show you my trading statements.
46:07
They're available Some trading
46:08
statements are actually available on my
46:09
website because people keep asking for
46:10
them. It's like, "These are These are
46:12
real trades." And anyone who's in my
46:13
discourse sees me place these trades
46:15
every week and again can confirm that
46:20
these numbers and these debits and entry
46:22
dates and exit dates are all are all
46:24
accurate. And as you know, John, of
46:25
course you are in that discourse, so you
46:27
you discourse you do see these uh these
46:30
Yep. So, yeah, so those are those are my
46:32
results. But John, I know that you also
46:34
trade this. So, how have you been going?
46:37
Well, this has been a very solid
46:41
I measure my results as the results of
46:44
compared to the buying power or the max
46:47
loss, which is most common way. Although
46:50
I fully agree with your
46:52
your way of thinking that you want to
46:56
risk more than half of your buying power
46:58
anyway on on on your trading. But I have
47:01
done 57 trades so far
47:05
over the last year and a year. And
47:09
46 of them have been winners. On
47:13
average, my average net profit per trade
47:19
It was a bit higher, but I did take a
47:20
couple of big losses in April. And I'm
47:24
have on average been 5.7
47:26
days in the trade. So, for me getting
47:29
more than 5% on a trade that is on
47:31
average lasting less than six days,
47:34
something I'm very happy with for sure.
47:40
So, let's sum up Sam. How would you sum
47:43
up this strategy in a few words?
47:47
Uh I would say it's a strategy
47:49
not for beginners, but intermediate to
47:52
advanced traders who want to have a
47:54
weekly trade that's Delta neutral. So,
47:56
you you don't know which way the
47:57
market's going, you want to try and
47:59
capture that theta decay and hopefully
48:03
you know, volatility moves, and a trade
48:06
that you don't have to look at
48:09
all day and be glued to your screen. Um
48:11
I've mentioned in the past um
48:14
I'm asleep for half the market, so
48:16
>> I can't watch it. So, yeah. I think many
48:18
have also watched on this channel an
48:21
interview with Steve Gunn's about his
48:24
fly diagonal strategy. That is
48:28
trading strategy. What would you say are
48:30
the difference between how you trade and
48:32
how Steve is trading this? To be 100%
48:35
honest, I've never like I've I've not
48:37
done Steve's course. I I don't actually
48:39
know his exact mechanics other than what
48:41
I've seen on your video. From what I can
48:43
glean looking at some of his you know,
48:46
option strat or not he doesn't use
48:47
option strat, he uses that other tool,
48:50
>> his graphs, it seems to me and this is
48:55
guess. I think he's a little bit tighter
48:57
in on the range, and so which can give a
49:00
nice a bigger sort of bump up in the
49:02
curve in the middle, but I think that
49:04
might lead to more adjustment. So,
49:06
without knowing the full details of of
49:08
his trade, I would say he probably has
49:10
to adjust it more than I do.
49:12
Um but the mechanics are the same
49:14
concept, and we we came up with these
49:16
trades independently. What would be the
49:17
two or three most important takeaways
49:20
you really want the audience to remember
49:22
from this interview? I would say that
49:24
getting the good curve is the secret.
49:27
Uh I would say getting out
49:31
no more than 24 hours to go is very
49:33
important, and I would say like we just
49:37
just talked about um allocate your
49:39
capital wisely. Don't throw all your
49:41
money at a single strategy. Good advice,
49:45
What would be good resources to learn
49:48
Uh well, I've as Well, as showing you, I
49:50
have my website. If you want to see all
49:52
the trading logs and graphs and um
49:56
find my email address and contact me,
49:59
through that. It's probably the easiest
50:01
way to get a hold of me. And what would
50:02
be a couple of good books to recommend
50:05
to Well, I was prepared I was prepared
50:07
for this, John. So, last time I was on,
50:09
I mentioned Julia's book, um
50:12
which is the Tastytrade one, The Unlucky
50:14
Investor's Guide to Options Trading. Uh
50:16
it's still a great book. It's very
50:18
mathematical, but I think it's a cool
50:19
book. I I bought two more here because
50:21
one of the things that a lot of traders
50:24
struggle with is mindset and discipline.
50:28
And you know, just putting random trades
50:29
on. And so, there's a book by um Mark
50:32
Douglas called uh Trading in the Zone.
50:35
Uh it's a really good book about mindset
50:38
uh sorry, it's a bit blurry, but Trading
50:40
in the Zone and it's if you're having
50:42
trouble with discipline, I recommend
50:43
that. And a book which is kind of almost
50:46
counterintuitive to to Tastytrade
50:48
mechanics and things like the standard
50:49
deviation and the expected move, there's
50:52
a great book called Fooled by
50:55
And uh the little tagline is The Hidden
50:58
Role of Chance in Life and in the
51:00
markets. And it's um
51:02
it's fascinating. It sort of explains
51:06
we get all these six
51:08
six or seven standard deviation moves
51:10
more regularly than we think because the
51:14
well, random. And so, Fooled by
51:16
Randomness is basically uh talking about
51:18
how you don't you can never know what's
51:20
happening. So, it's a very interesting
51:21
read. I it's uh it's not purely a
51:23
trading book, but it's if you're a
51:24
trader, I think you'll find it really
51:26
interesting. Thank you very much, Simon,
51:28
for uh coming back here on Theta Profits
51:30
to uh share your time flies strategy and
51:33
how you uh trade it and how you uh
51:36
adjust it and your pretty amazing
51:39
results, I would say, over our three
51:42
years. We do have a number of other
51:44
interviews that might be relevant. I
51:47
uh show a couple of them on the on the
51:49
screen here. Thank you very much again,
51:53
Thank [snorts] you very much, John. It's
51:54
been an honor to be your first return
51:58
All the and all the best trading with
51:59
Tom fights for yourself.